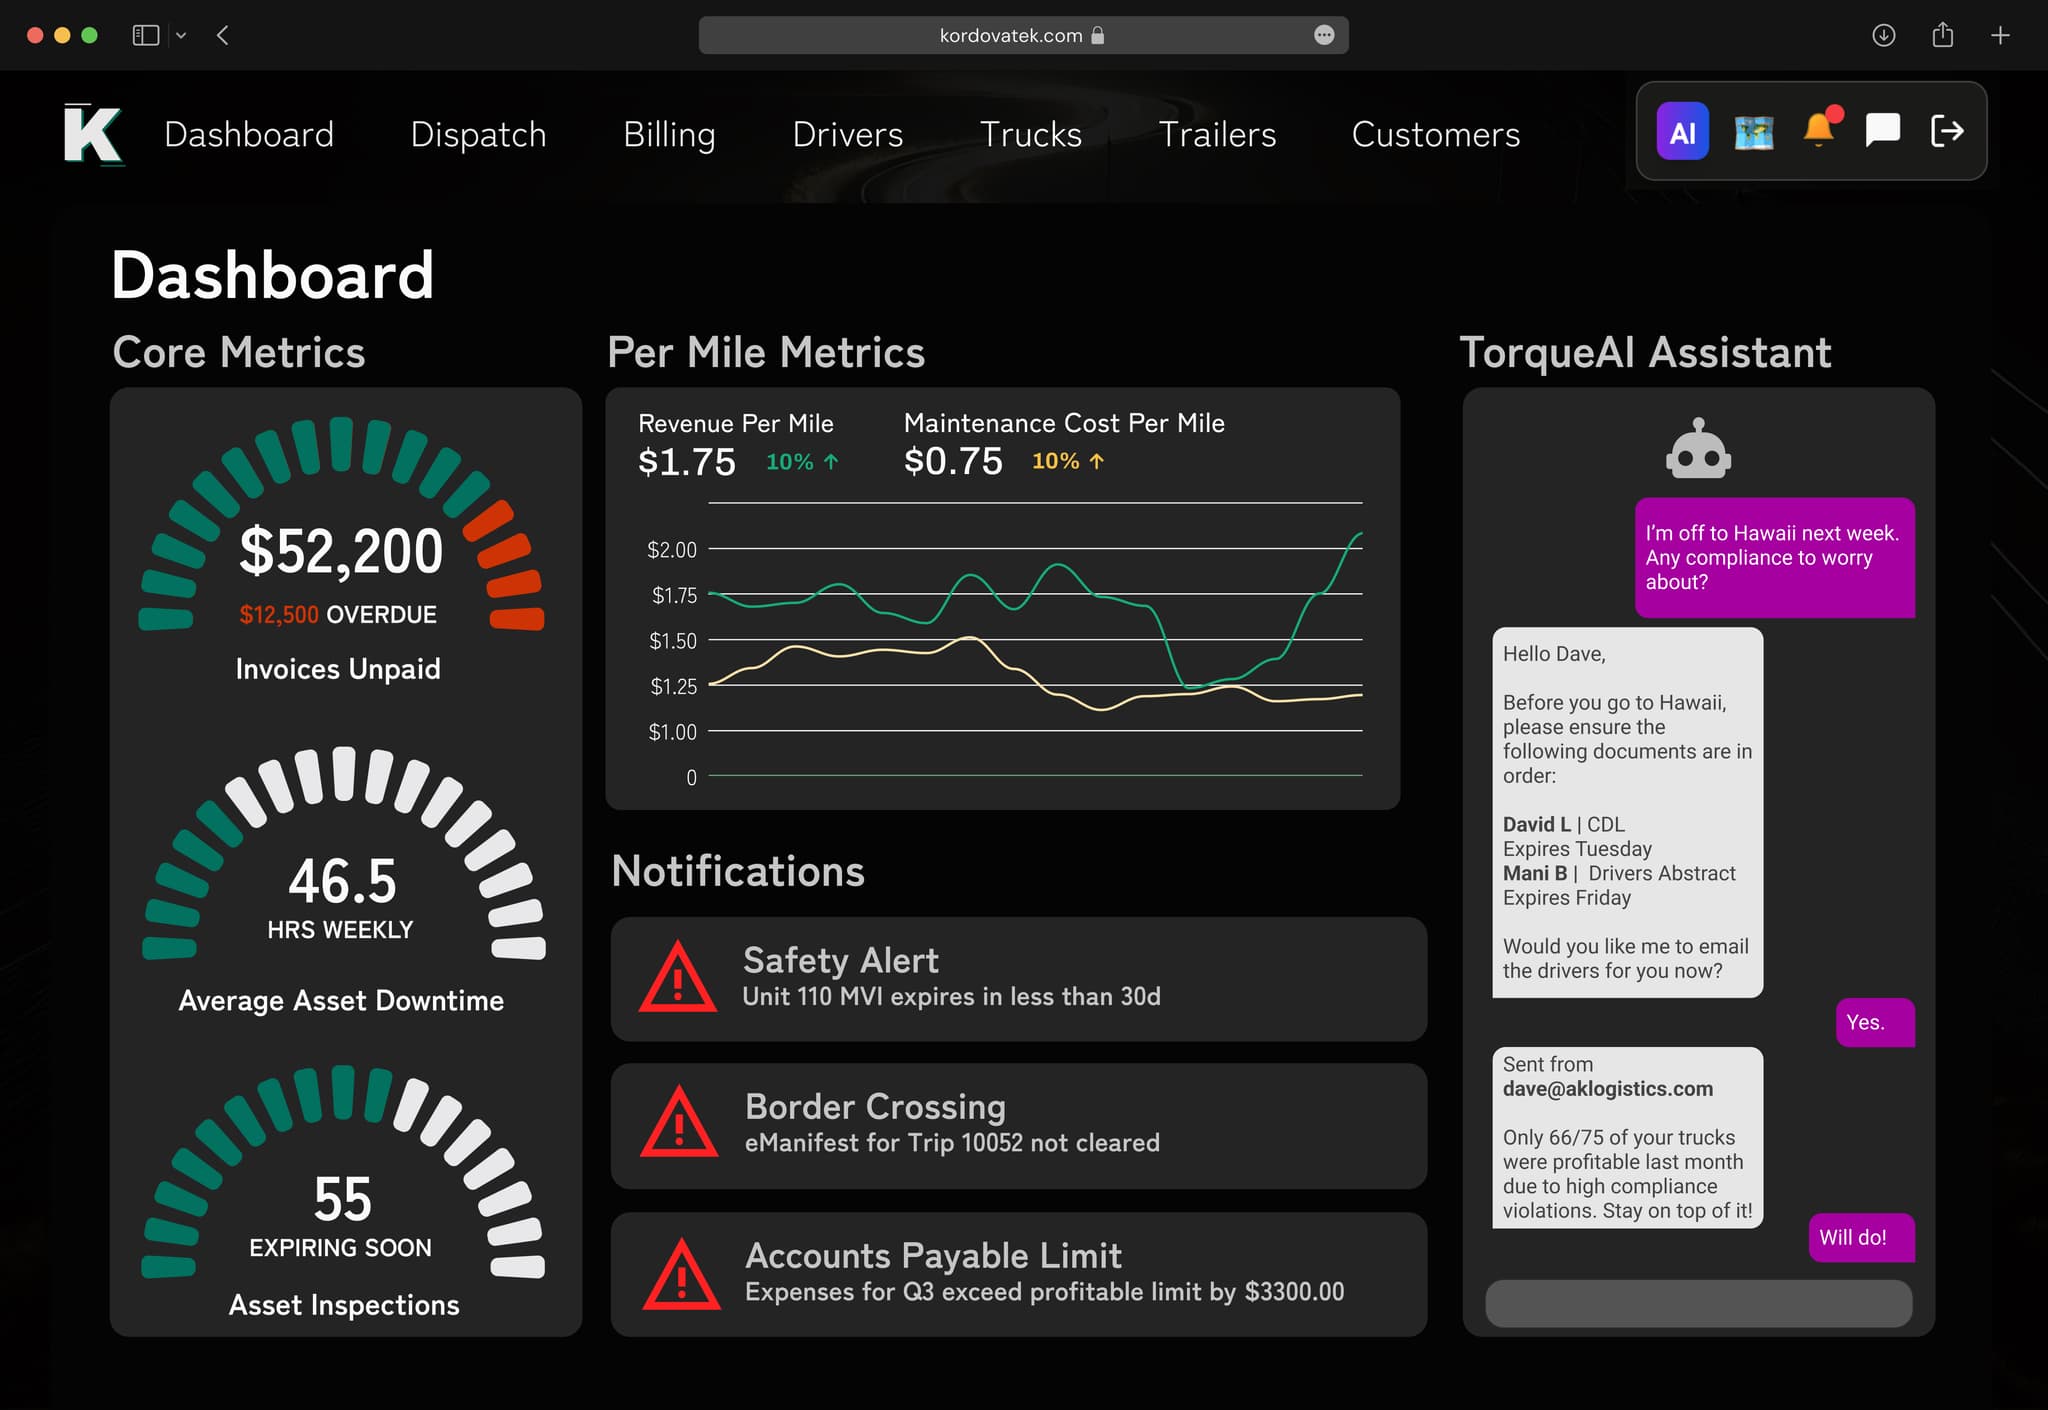
To know profit per load before you book it, you need your real cost for that truck on that lane. A rough fleet average is not enough. TorqueAI builds those costs from your actual fuel, driver pay, maintenance, and miles, and shows real-time profit and loss per load, lane, mile, and truck. So when a broker offers a rate, you can tell if it is worth taking.
The rate looks good. Is it?
A broker calls with a load that pays well per mile. You take it. Two weeks later you realize the pickup was 180 miles from where your truck was empty. The receiver held the driver for hours. The truck came back on a cheap backhaul. And that truck was due for brakes.
On paper the load was good. In your bank account, it was close to zero.
Most small carriers run this way. Revenue is easy to see because it is on the rate con. Costs are scattered:
- Fuel is in the fuel card portal.
- Driver pay is in the payroll spreadsheet.
- Repairs are on shop invoices in a drawer.
- Miles and deadhead are in the ELD.
- Tolls and insurance are in QuickBooks.
Nobody has time to pull all of that together per load. So the real answer shows up at year-end, when it is too late to change anything.
How TorqueAI puts a number on every load
TorqueAI already has the pieces, because it runs dispatch, payroll, maintenance, and accounting. It also connects to the tools that hold the rest.
- Revenue comes from the rate con. The AI reads the rate confirmation and records the rate and accessorials.
- Miles come from your ELD. Loaded and empty miles flow in from ELDs like Motive, Samsara, Geotab, and Knight ELD.
- Fuel comes from your fuel card. Transactions from EFS, Comdata, WEX, AtoB, and others are tied to the truck and the trip.
- Driver pay comes from settlements. Since payroll builds from loads, pay cost is already on each load.
- Maintenance comes from the shop. TorqueAI Maintenance tracks work orders, parts, and labor per truck.
- The P&L updates live. Profit per load, lane, mile, and truck is ready as loads close, with AI-driven trends showing what is improving and what is slipping.
When the next rate comes in for a lane you have run before, you already know what that lane costs you.
Guessing vs. knowing
| Question | Without real-time P&L | With TorqueAI |
|---|---|---|
| Is this rate worth taking? | Gut feel and fleet average | Past results for that lane and truck |
| Which lanes lose money? | Unknown until year-end | Profit per lane, updated live |
| Which truck costs the most? | Rough idea from repair bills | Cost and profit per truck |
| How much does deadhead cost? | Rarely tracked | Empty miles from ELD tied to each load |
| What did fuel cost on this trip? | Matched by hand, if at all | Fuel card transactions linked to the trip |
| Are things getting better? | Wait for the accountant | AI-driven trends per lane, mile, and truck |
What owners usually find
Every fleet is different, but the same kinds of surprises come up when owners first see profit per truck and lane:
- A lane they love is thin. High rate, but long deadhead or slow unloads eat the margin.
- One truck drags the fleet down. Repairs and downtime make it cost far more than the others.
- A customer is not worth the hassle. Detention, short pays, and slow payment add up.
- A backhaul they avoided actually helps. It cuts empty miles on a strong outbound lane.
None of these show up on a revenue report. All of them show up on a P&L per load. To learn the math behind it, read our guide on how to calculate cost per mile.
Who this is for, and who it is not for
A good fit:
- Owners of 1 to 500+ trucks fleets who book loads off load boards, brokers, or direct shippers
- Fleets with mixed equipment ages where some trucks cost more to run
- Carriers running a few repeat lanes who want to know which to grow
- Operations that also broker freight and want to compare margins
Not a fit:
- A fleet on one dedicated contract with fixed pay and fixed lanes. There is less to compare.
- Anyone who only needs a year-end tax report. Your accountant can do that from QuickBooks.
What switching looks like
- Go-live: Most fleets are up and running within 24 hours. Our team handles setup, data migration, and training.
- Connections first: We connect your ELD, fuel cards, and QuickBooks so costs start flowing in right away. TorqueAI has 100+ integrations.
- Numbers grow over time: Each load you run adds to your lane and truck history.
- Your data: Stays yours, with a full export in standard formats. No lock-in. SOC 2 compliant with enterprise-grade encryption.
Profit tracking works best when payroll runs from the same data. See how on our trucking payroll software page, read more about tracking profitability by truck, load, and driver, or explore TorqueAI.
Last updated November 6, 2026